
The Illness has exposed our financial fragility,
An orgy of borrowing, speculation, and euphoria has left the markets on the verge of a catastrophe.

Financial markets have experienced the fastest ever crash over the past few weeks. Even during the dotcom bust and the Lehman crisis, stocks did not fall this quickly. In less than a month, we have seen major indices fall almost 30%, and stocks in sectors such as oil and travel down by 80%. We are experiencing terrifying daily declines not seen since the 1929 stock market crash that preceded the Great Depression.

We are at a watershed moment: this illness is a catalyst fast bringing many long-simmering problems to the boil. It is exposing the creaking financial systems around us and it will change the way economies function. Economic and financial pundits, however, have been focusing almost exclusively on the short-term effects of coronavirus and so are missing the much bigger themes at play.

Epidemiologists tell us that when it comes to the virus, we are looking at a once in a century event. It is highly contagious and highly lethal. Experts are not comparing this illness to SARS or Swine Flu, but to the Spanish influenza of 1918 that killed between 50 and 100 million people worldwide.

We do not have good data on what the stock market did during the 1918 flu, but we do know that it led to a severe recession. The connection between influenza and recessions is well documented. Going as far back as the Russian flu in 1889-90, the Spanish flu in 1918, the Asian flu in 1957-58 and the Hong Kong flu of 1968-69 — they all led to recessions. This one will be no different.
Those were the words of Jonathan Tepper today, the founder of Variant Perception, a macroeconomic research group.
As of the end of this week both the states of California and New York, are now on indefinite lockdowns, as the growth of this illness within the United States is moving at a clip faster than many thought possible.
--
This week the S&P 500 fell -15% in its biggest weekly drop since October 2008.
US stocks are now nominally valued at their lowest levels in three years of time.
Let’s get a longer-term perspective of where we currently are in this stock bear market, with Scott Minerd, a public silver bullion bull since $35 oz back in the year 2012.
A bond trading billionaire, who knows the endgame of this fiat financial system leads to revaluations higher for precious things.
-
See the Goldman Sachs unemployment research chart. The situation might be even worse.
The state of Ohio alone is ignoring President Trump’s plea to not report jobless claims. They are reporting daily. Last week 4,815 filed for unemployment insurance. Sunday through yesterday Thursday of this week 139,468 filed for unemployment.
Perhaps we may see as high as 3 million unemployments filed once the data fully filters in.
-
Calls for losing around -1/4th of the nation’s GDP or gross domestic product are also making the commercial bank research rounds this week.
Threats of potential financial terror are now yielding bailouts of almost anything and anyone globally.
We are now back nearing fall 2008 levels, in terms of government and central bank market interventions.
Late last week, we ended our market update wondering what US Treasury Secretary Steve Mnuchin meant by providing Unlimited Liquidity to the financial markets.
Now we are starting to see trillions of commitments by this administration and other financial authorities around the world.
Here are just some of the headlines from this week regarding escalating overnight REPO loans, and those are the primary dealer banks who may be involved in this festering and financially troubling situation.
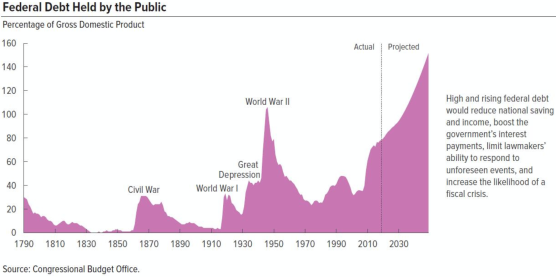
Perhaps bondholders may want to look back to the post WW2 high US dollar debt level era to see who took the largest haircuts back then as inflation melted away much of the battle accrued debts.
The private Federal Reserve has not had time to update its FRED balance sheet charts but this data here shows they are actively taking more items in their books.
Here is how their FRED chart will look by the time they get around to updating it.
With this current dire economic situation, we will likely see their balance sheet more than double in the coming years.
-
Word out of the Royal Canadian Mint this week is their bullion production facility and the entire staff will be taking a minimum two hiatus for their personal safety.
As you likely well know by now, the physical precious metal bullion industry is lacking in bullion supplies all while demand remains at very high levels.
This current silver bullion product shortage situation has now bled over into vanishing platinum and gold bullion supplies as well.
-
The COMEX driven spot prices for gold and silver continue to approach a not since the 1930s Great Depression high, now nearly 120 gold-silver ratio at the moment.
Yet there is virtually nowhere in the world where you can trade 1 oz of gold bullion for 120 oz of silver bullion or for that matter too, 1 ounce of gold bullion for almost 2.5 ounces of platinum bullion.
The best ‘free-market’ data we have currently on the American Gold Eagle vs American Silver Eagle coin sales ratio is showing a current GSR of around 83. It was even lower only a few days ago.
And while there may be about a year and a half worth of annual Indian silver import volumes sitting in current COMEX warehouses. Hard to say at what silver spot price much of the lighter green pile will convert to a darker green and possibly get withdrawn from that leveraged fractional reserved supposed silver price discovery process.

Another question comes to mind, who would be able to work and actually have the immediate capacity converting those non-homogenous 1,000 oz silver bars in silver bullion products investors and dealers would like to have on hand today.
Next week we’ll be back to talk about the ongoing ramping fiat currency fueled bailouts.
We will see if this US stock market bounced, or if it will just continue devaluing to gold bullion as this trend looks set for the decade to unfold.